- Project Outline -
Project: Conduct user research for FoodCloud on reducing food waste in the hospitality sector in Ireland.
Team: 3 people.
My role and responsibilities: collaborate with my team and other stakeholders, conduct interviews, create visuals of data collected, create and edit reports
Tools used: Microsoft Word, PowerPoint, Miro.
Date: September 2018 - December 2018.
- Introduction -
This is a project I worked on in the final year of my Engineering degree. I worked with two others on this project. We collaborated with FoodCloud on this project. FoodCloud is a social enterprise that aims to reduce food waste and hunger within Ireland and the UK. FoodCloud gave my group this prompt:
"How might we effect a step-change reduction of food waste in the Hospitality and Food Service (HaFS) sector by 2020?"
My team and I used a number of research techniques such as interviews, online research, surveys, and observation to investigate the HaFS sector. Through the use of certain tools, like stakeholder maps, empathy maps, POV statements, and personas, key findings on various topics such as supplier logistics and waste sorting, were discovered and documented.
- Stakeholder Map -
The stakeholder map, shown in the image below, is a visual representation used to recognise each individual or group that has a direct influence on the design challenge. Each stakeholder was ranked by their potential influence on the chain. This process helped my team identify the key stakeholders to better engage them and spot any potential problem nodes. For the interviewing process, my team chose to focus on retailers, the staff at FoodCloud, charities, and the end user.
Stakeholder map for FoodCloud Project (created by my team)
- Empathy Maps -
In order to create an effective solution it requires a better understanding of the stakeholders. Empathy maps are a useful tool. They allowed my team to synthesize our research data to better understand the pains and gains of the stakeholders. Our empathy maps were developed based on research from articles, web searches, interviews and surveys. This was especially helpful as it allowed us to get into the mindset of the user and empathize with them.
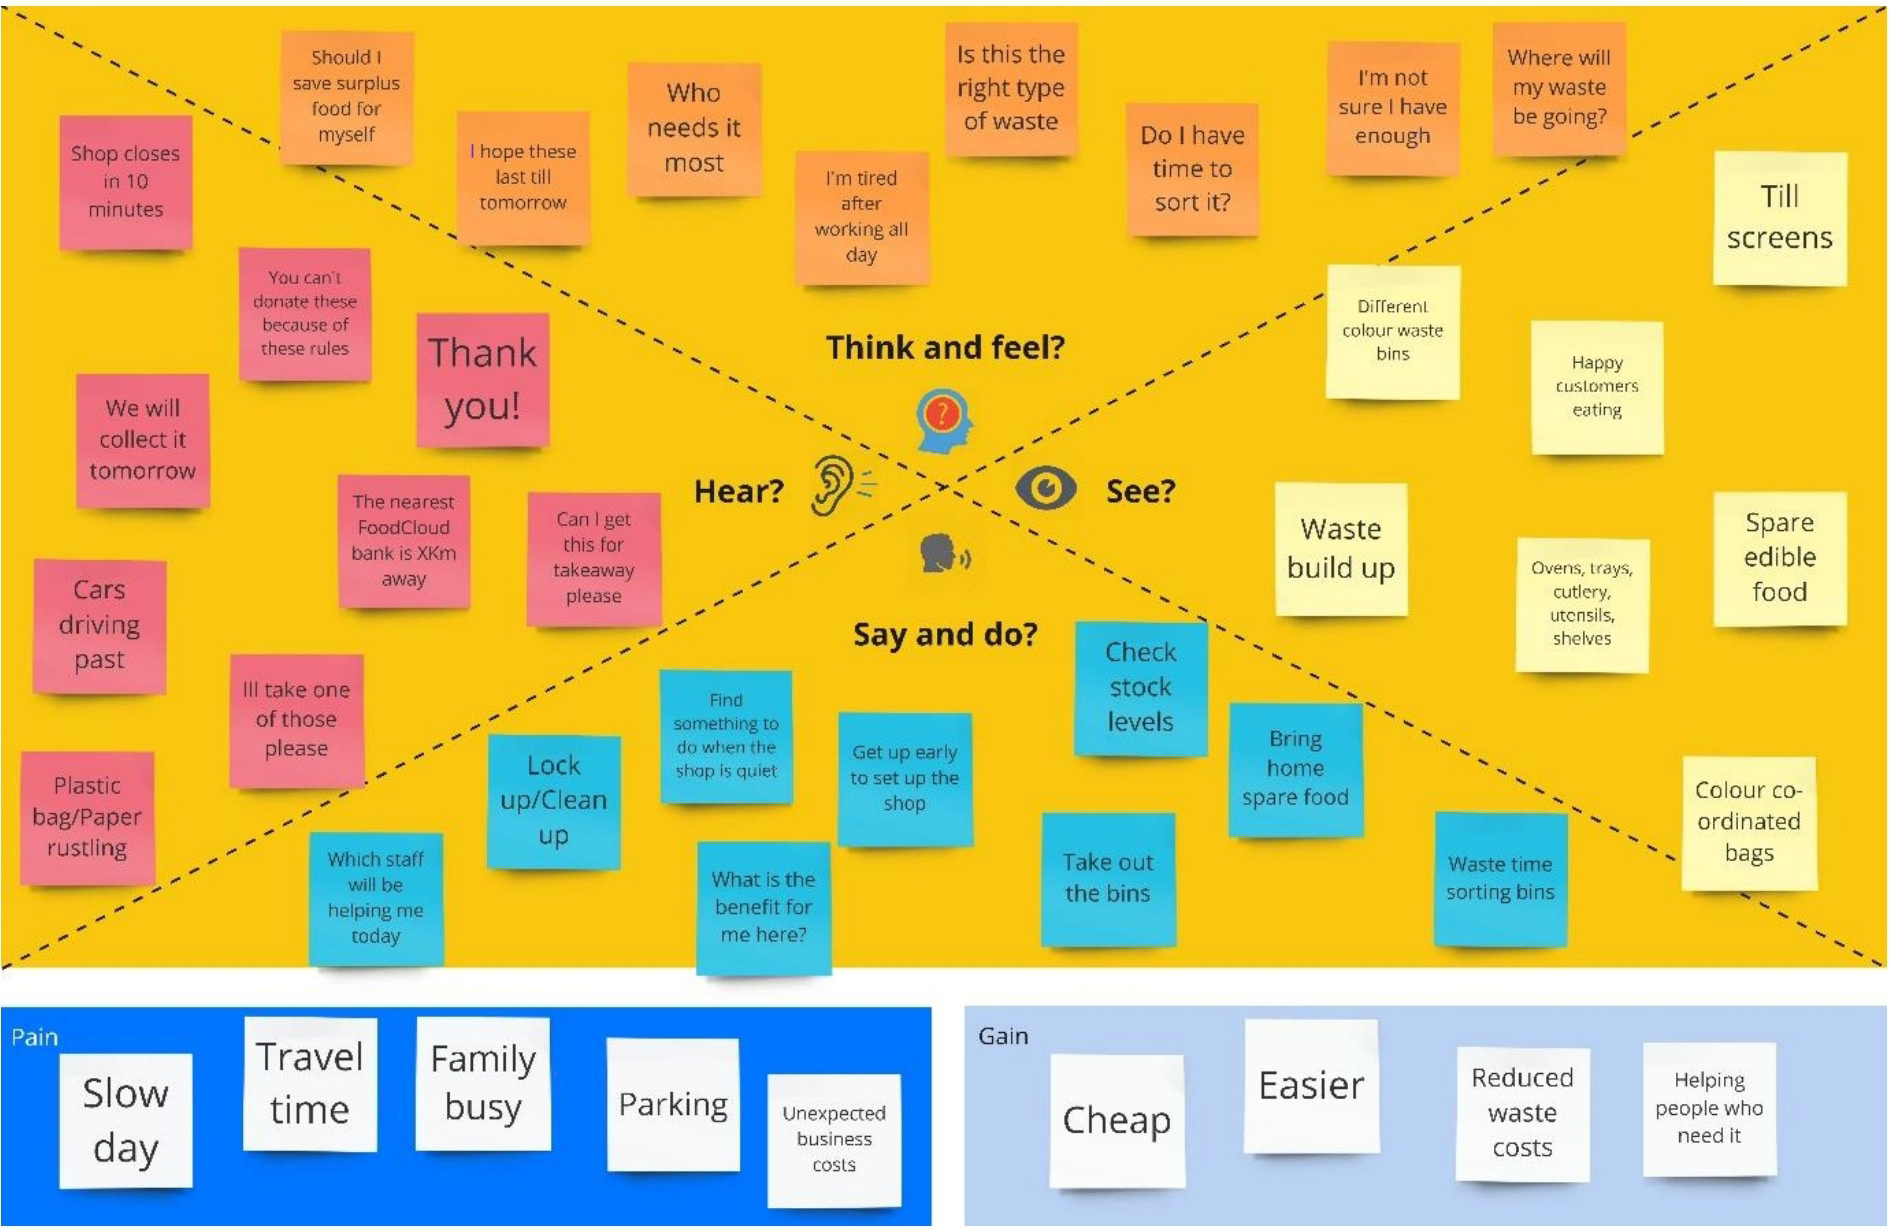
Empathy map for bakery employee
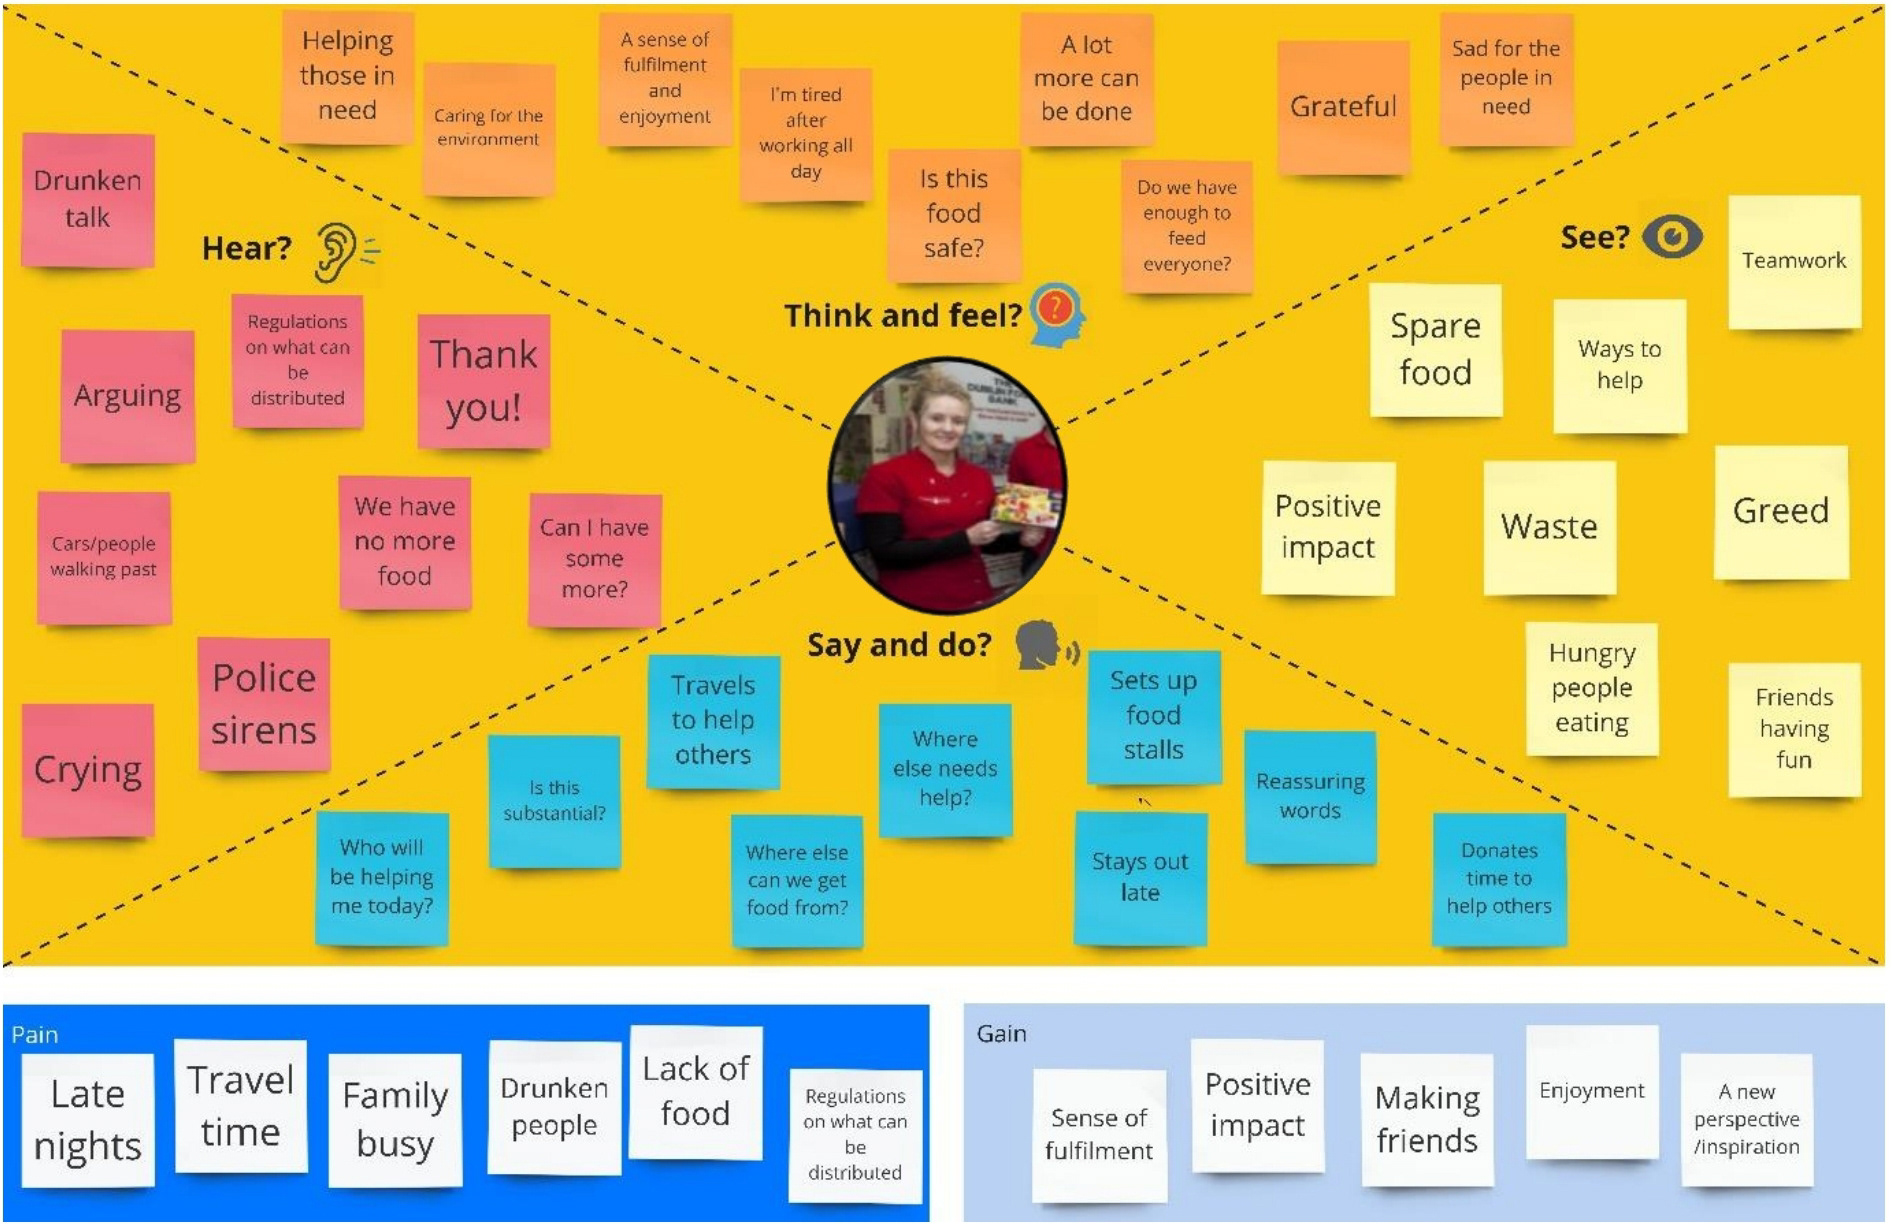
Empathy map for charity worker
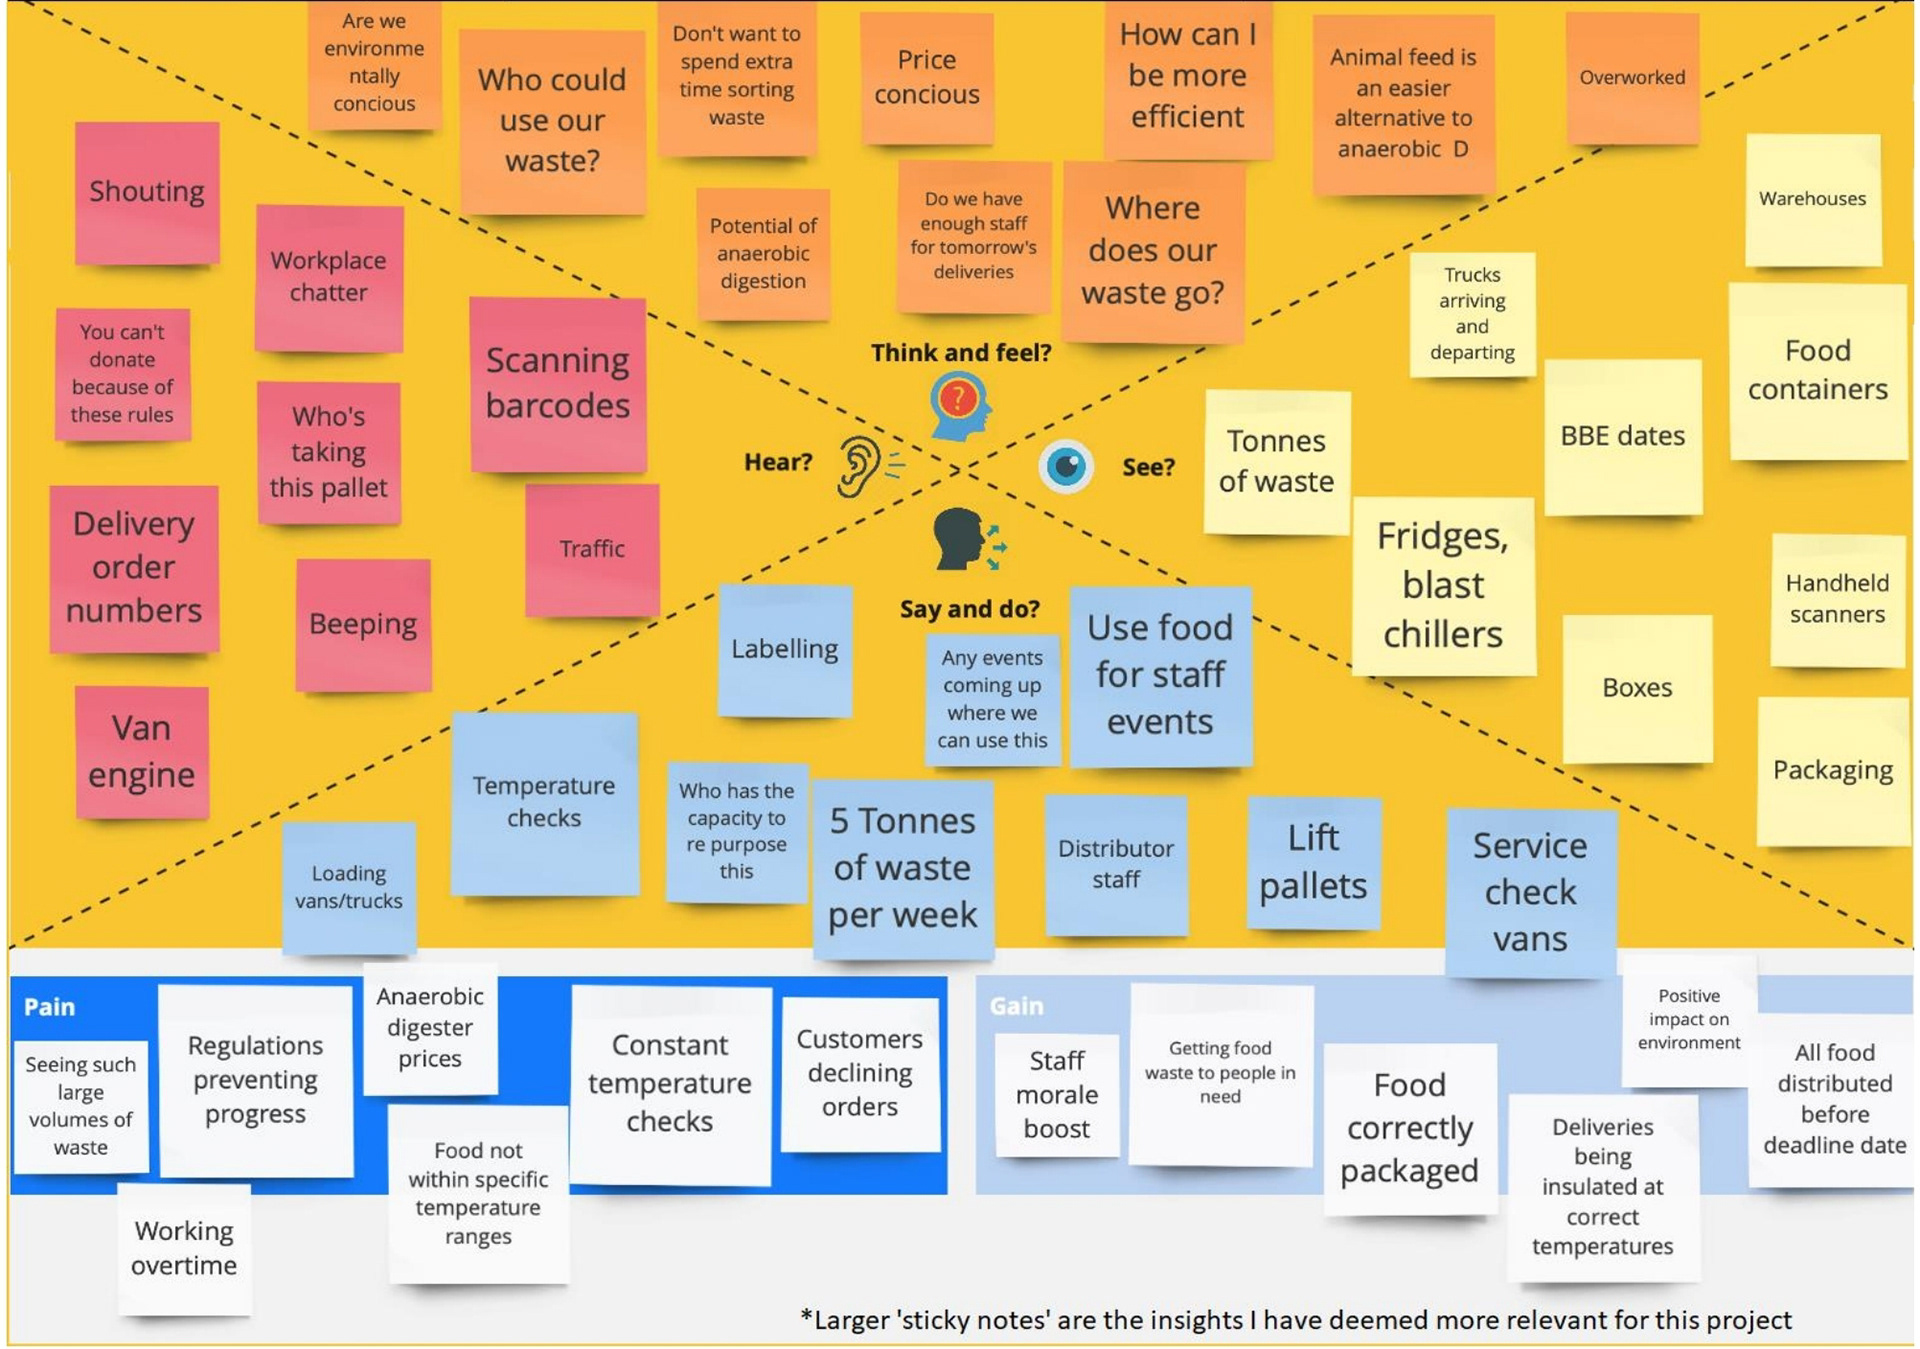
Empathy map for delivery driver
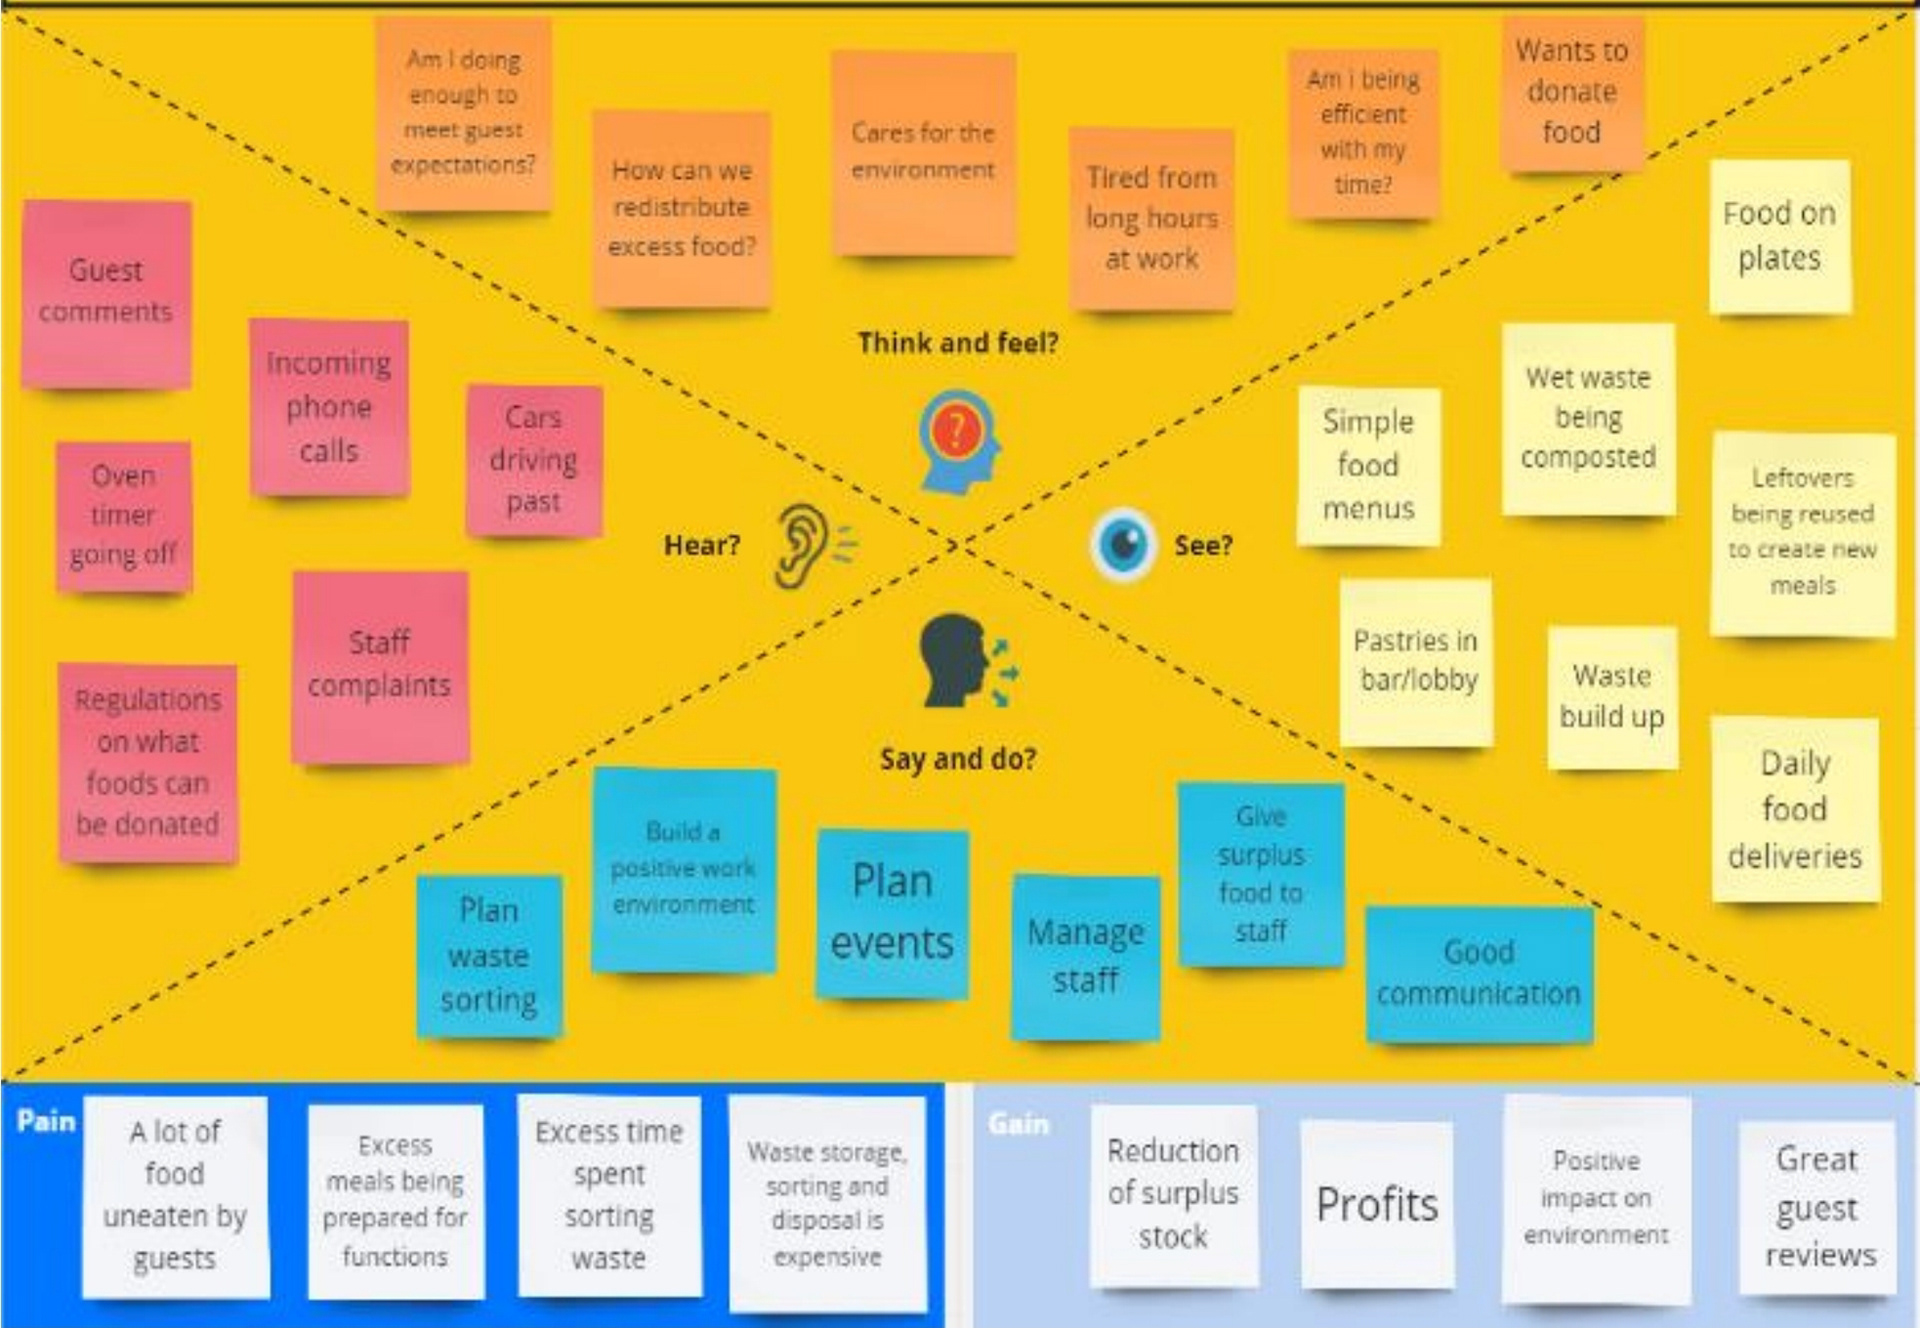
Empathy map for hotel manager
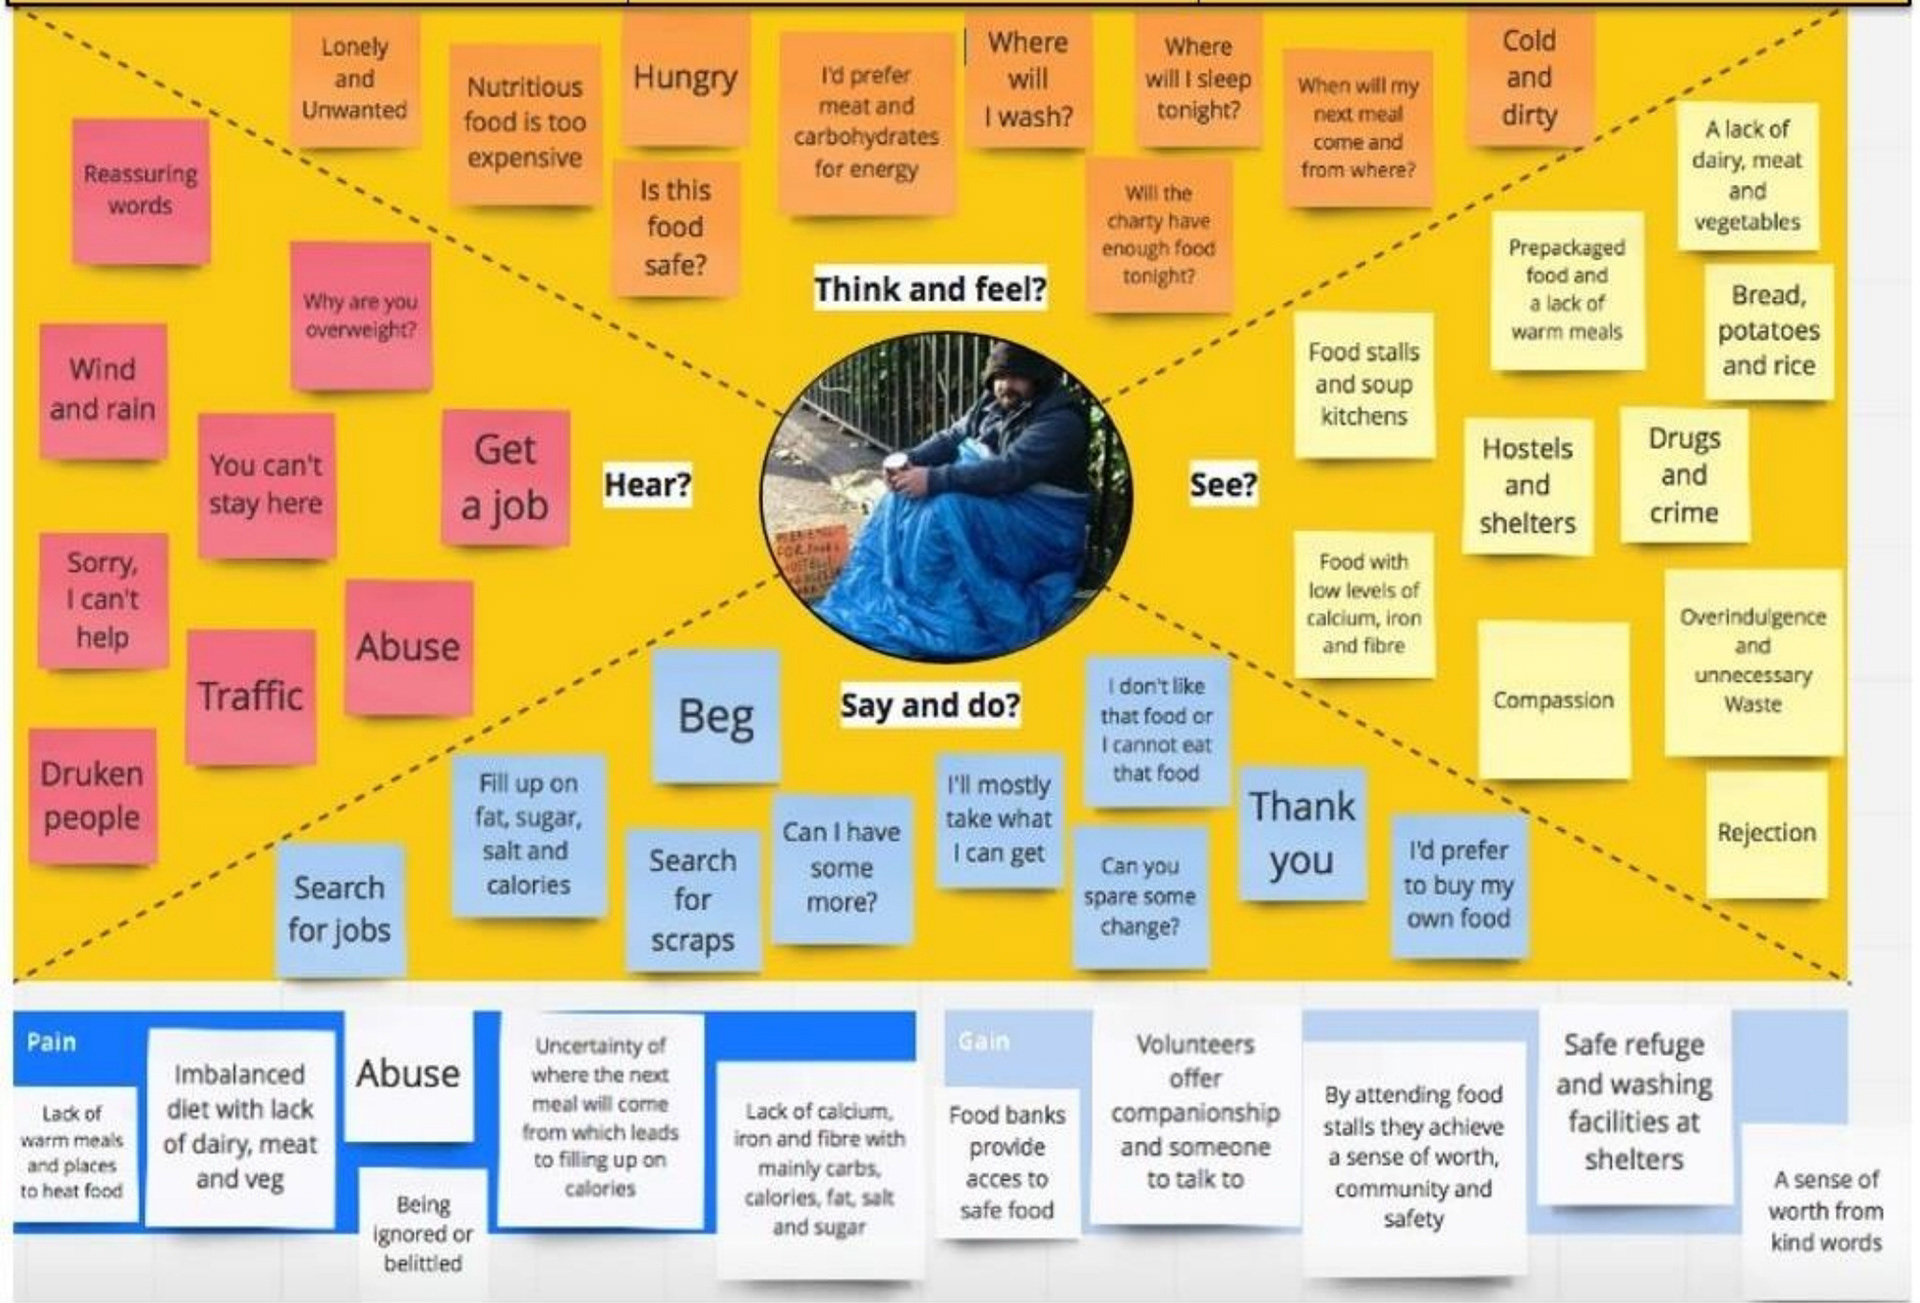
Empathy map for end user
- Personas -
For our created personas we tried to include one person from each stage of the food chain in order to illustrate a group of potential users from varied background in the hope this would highlight a representative from each corner of our wide solution space. We included each link in this food chain from suppliers and manufacturers right up to the end user, so nothing was left untouched. The most prominent need finding technique used was interviewing however we also used research techniques like internet research and direct observation to help us create rounded personas for each. Multiple interviews were conducted at each stage which allowed us to include insights from many separate users into each single persona. They are color coded to help link information with basic background information in blue and green, goals in yellow and pains, one of the most important sections, in red. The insights we gained were mostly from the pains section of each need finding exercise.
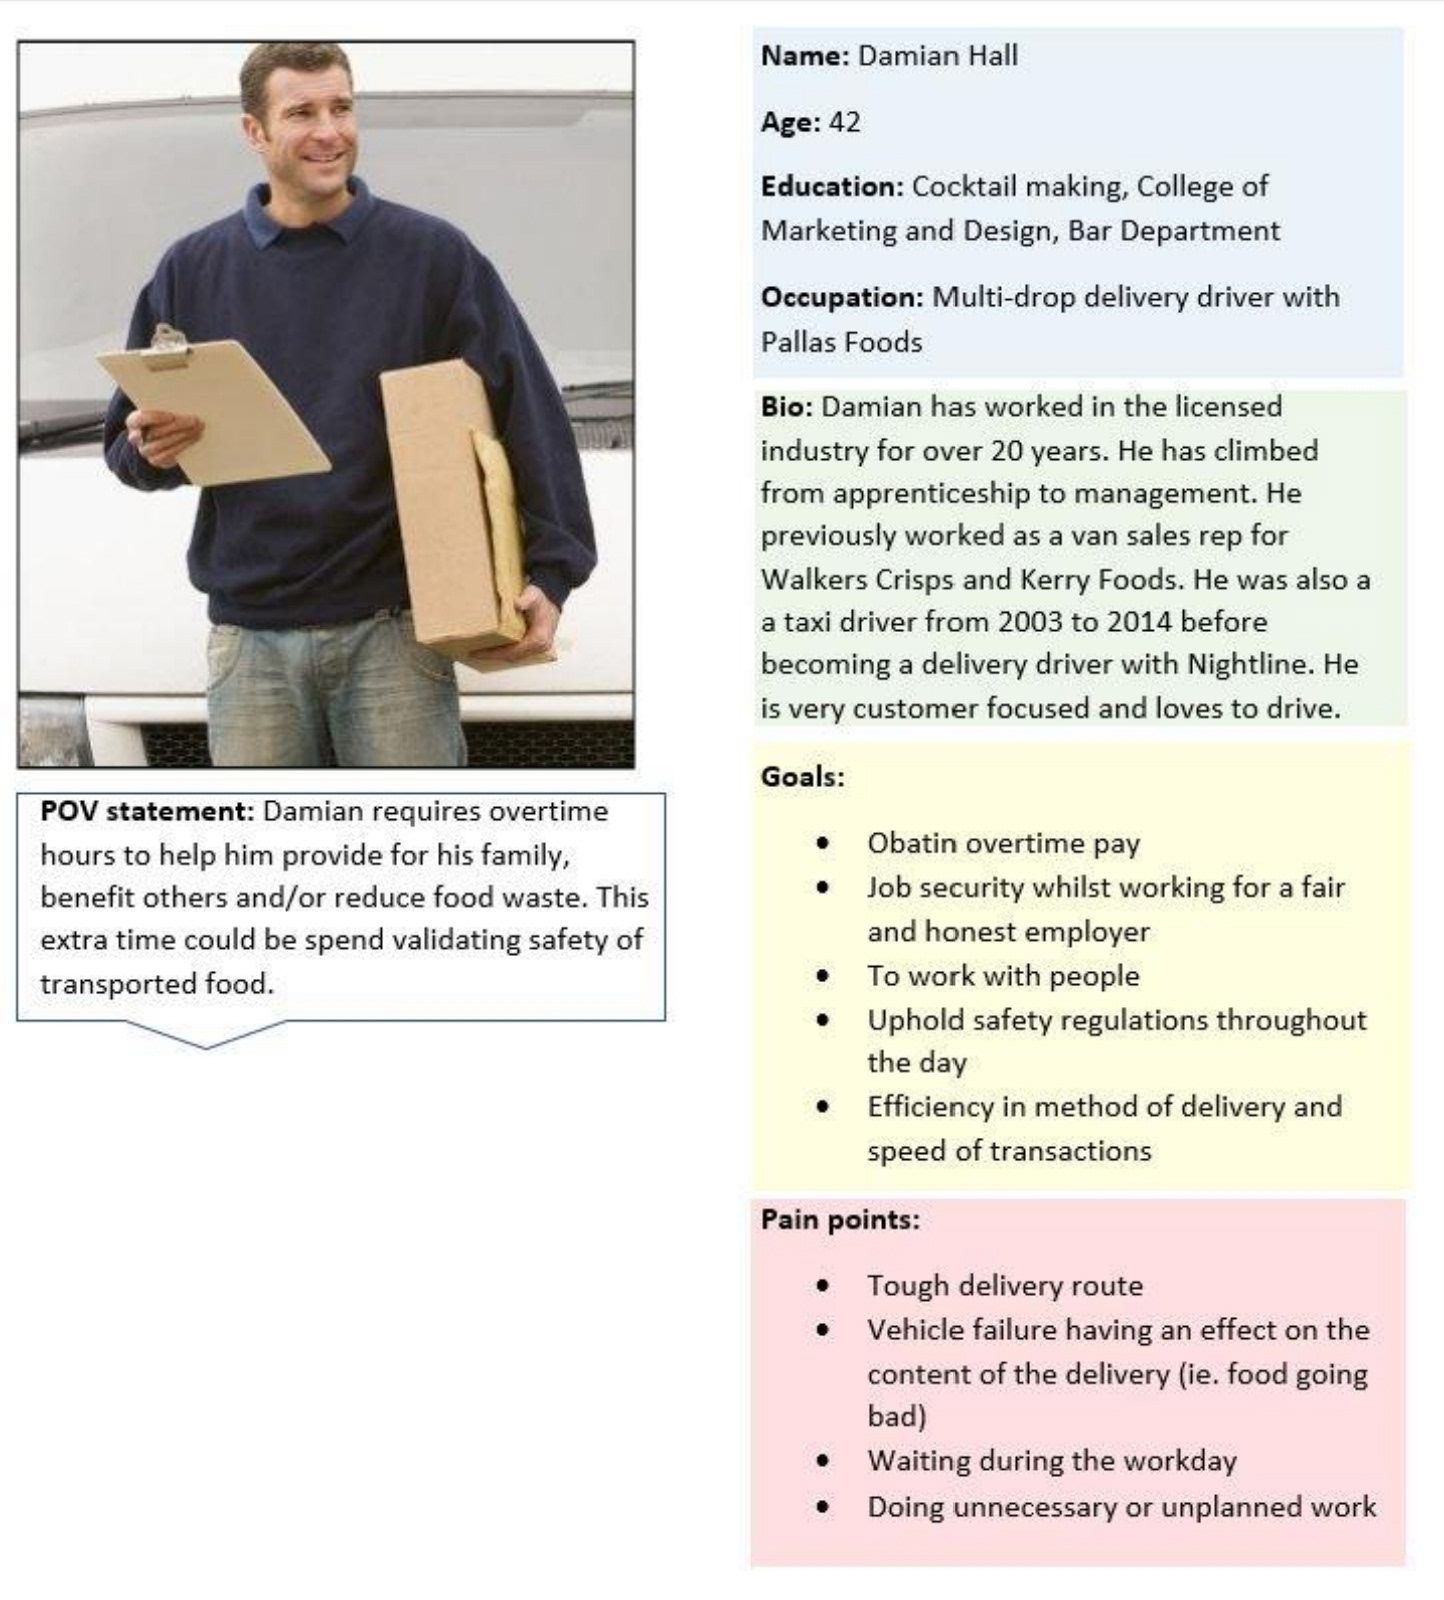
Persona for delivery driver
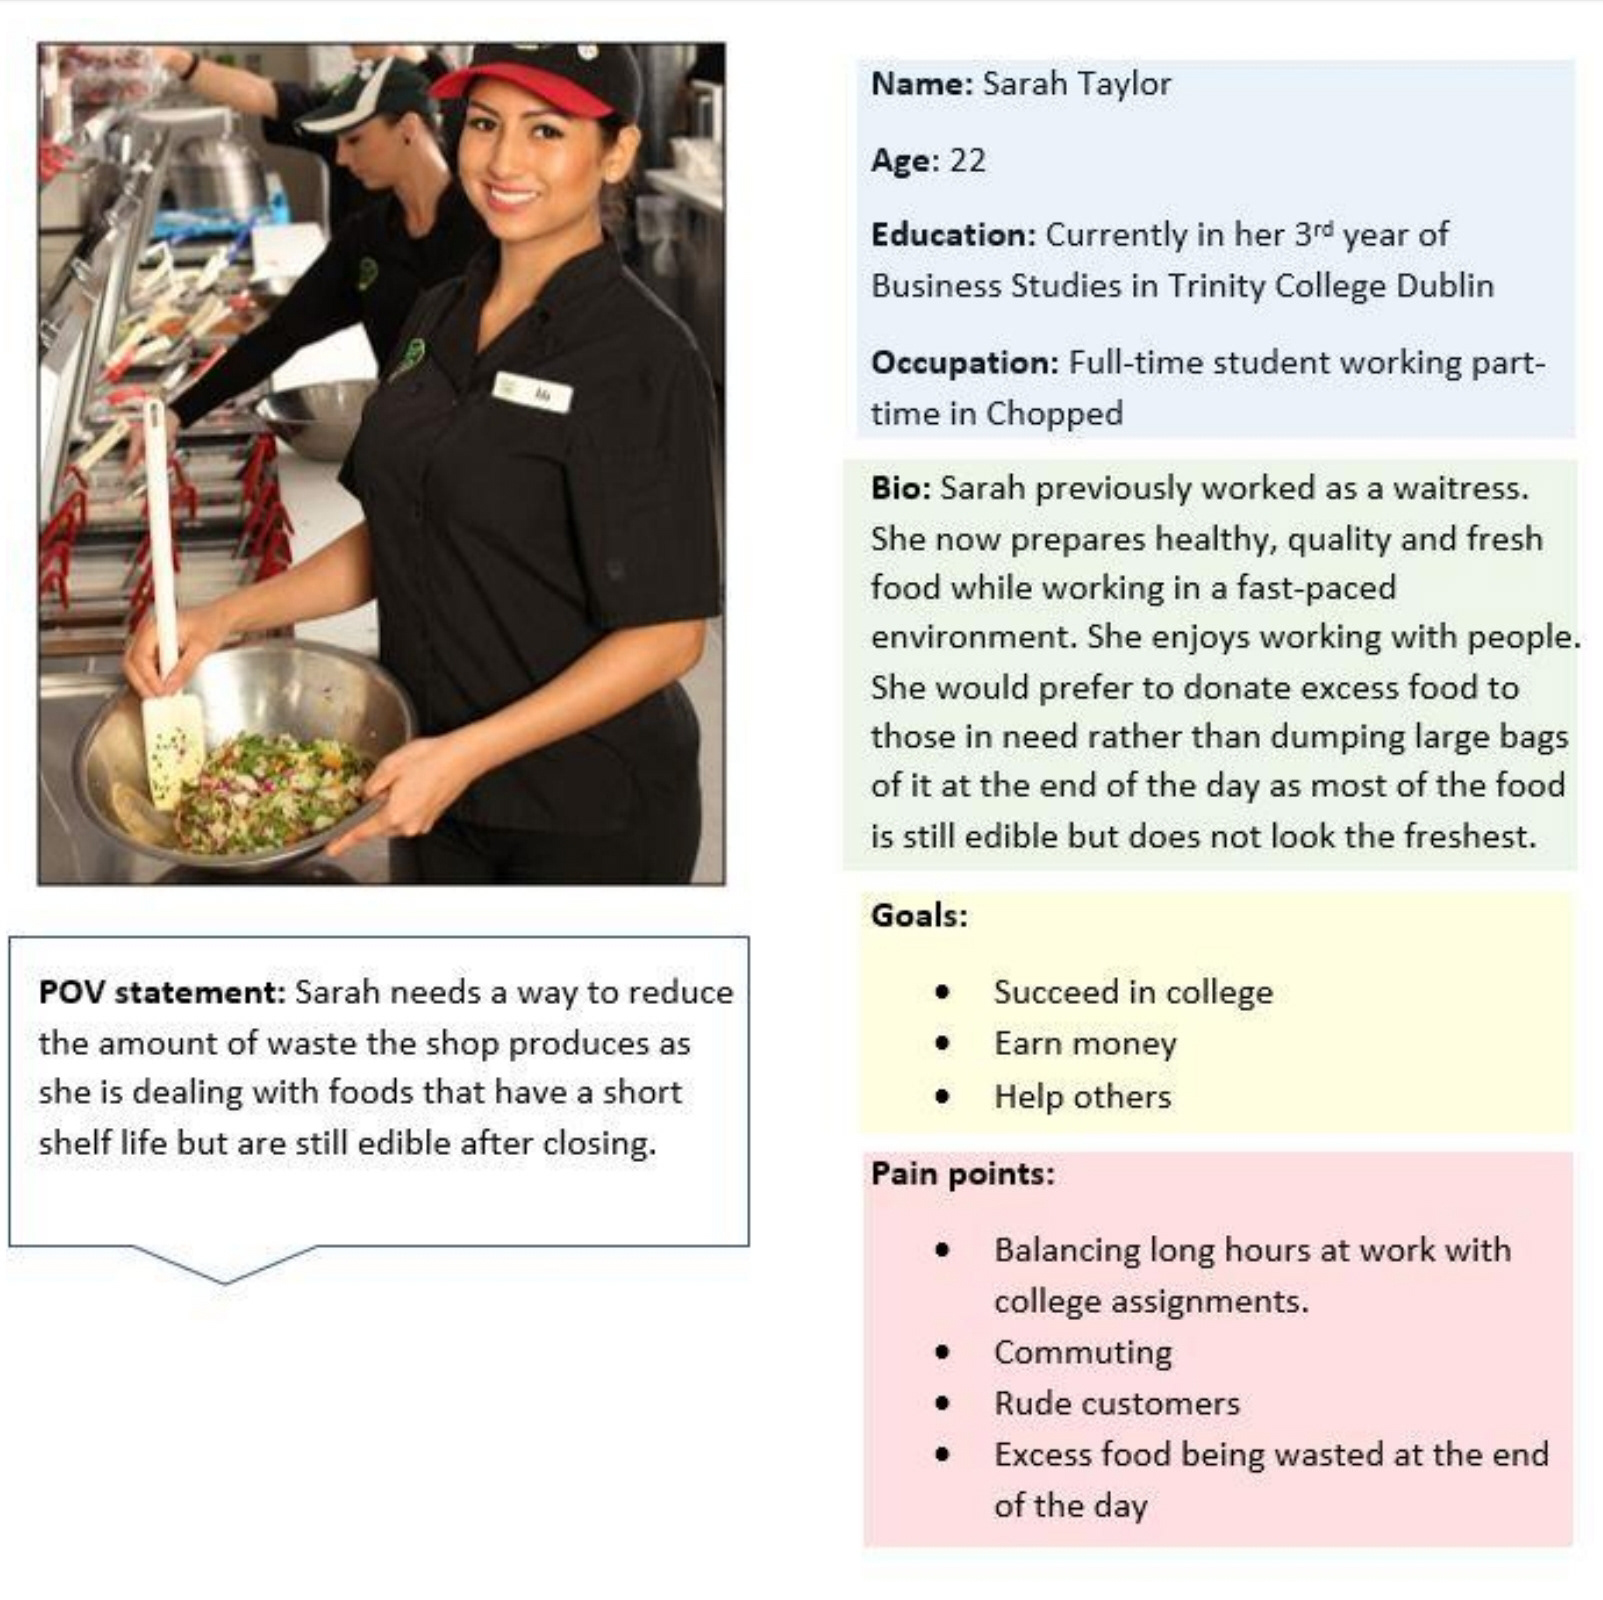
Persona for food retailer
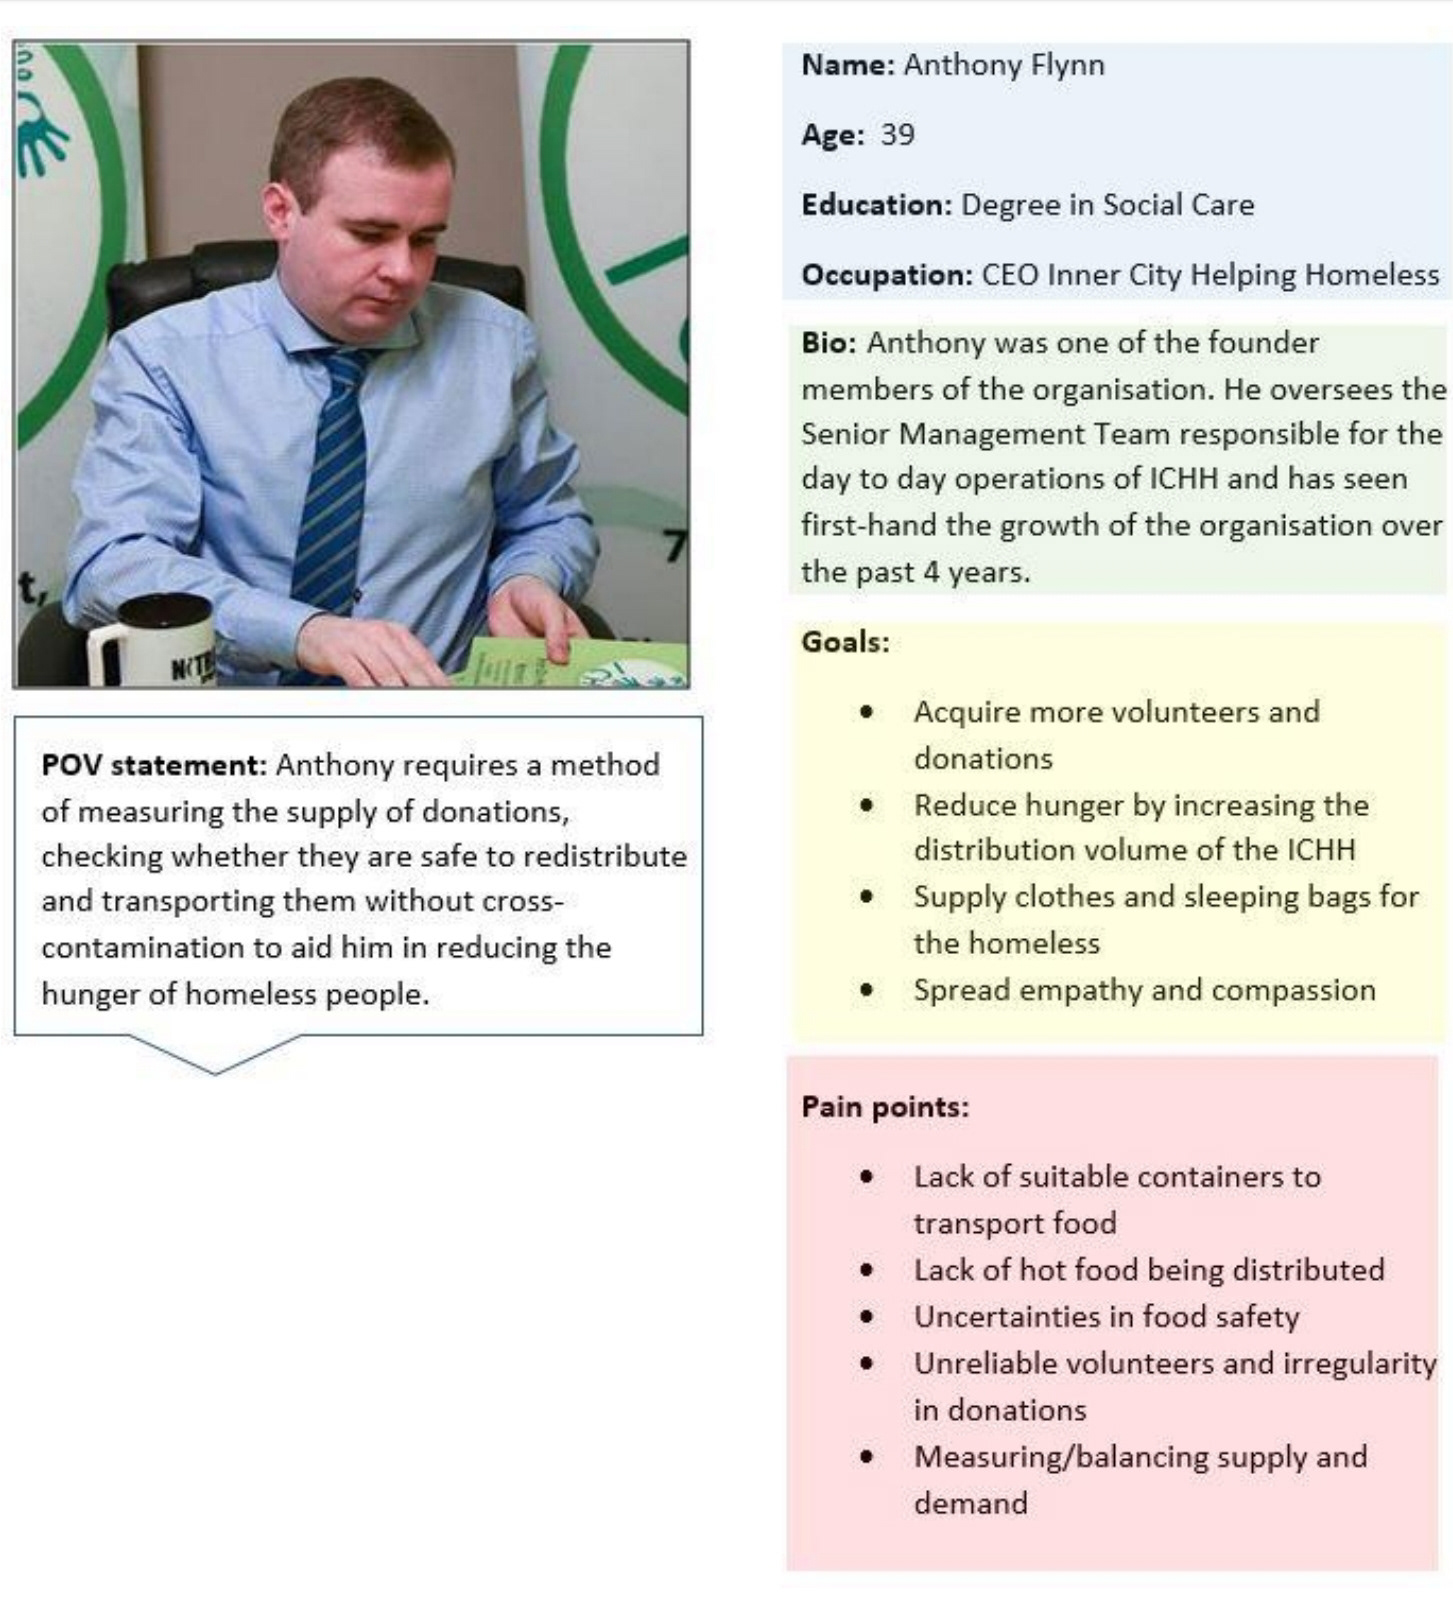
Persona for charity worker
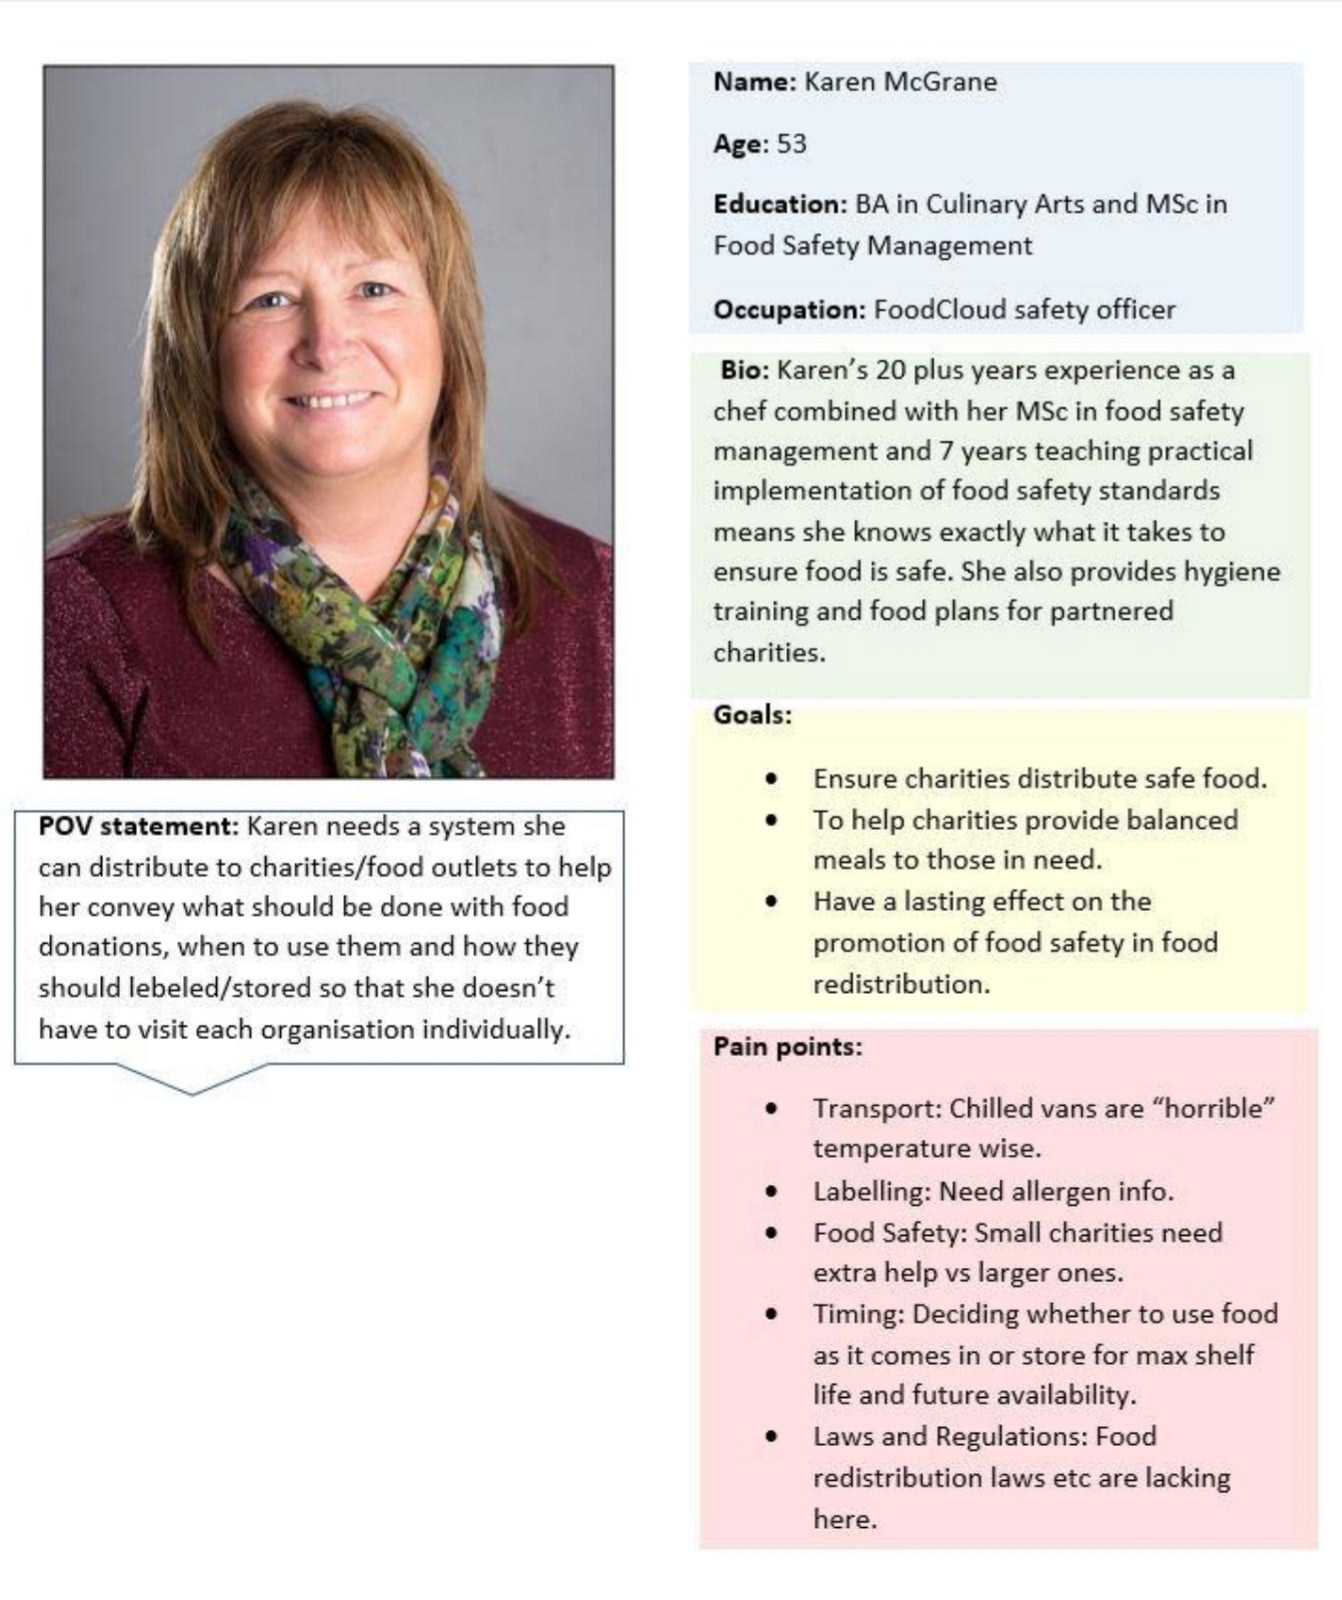
Persona for food safety officer
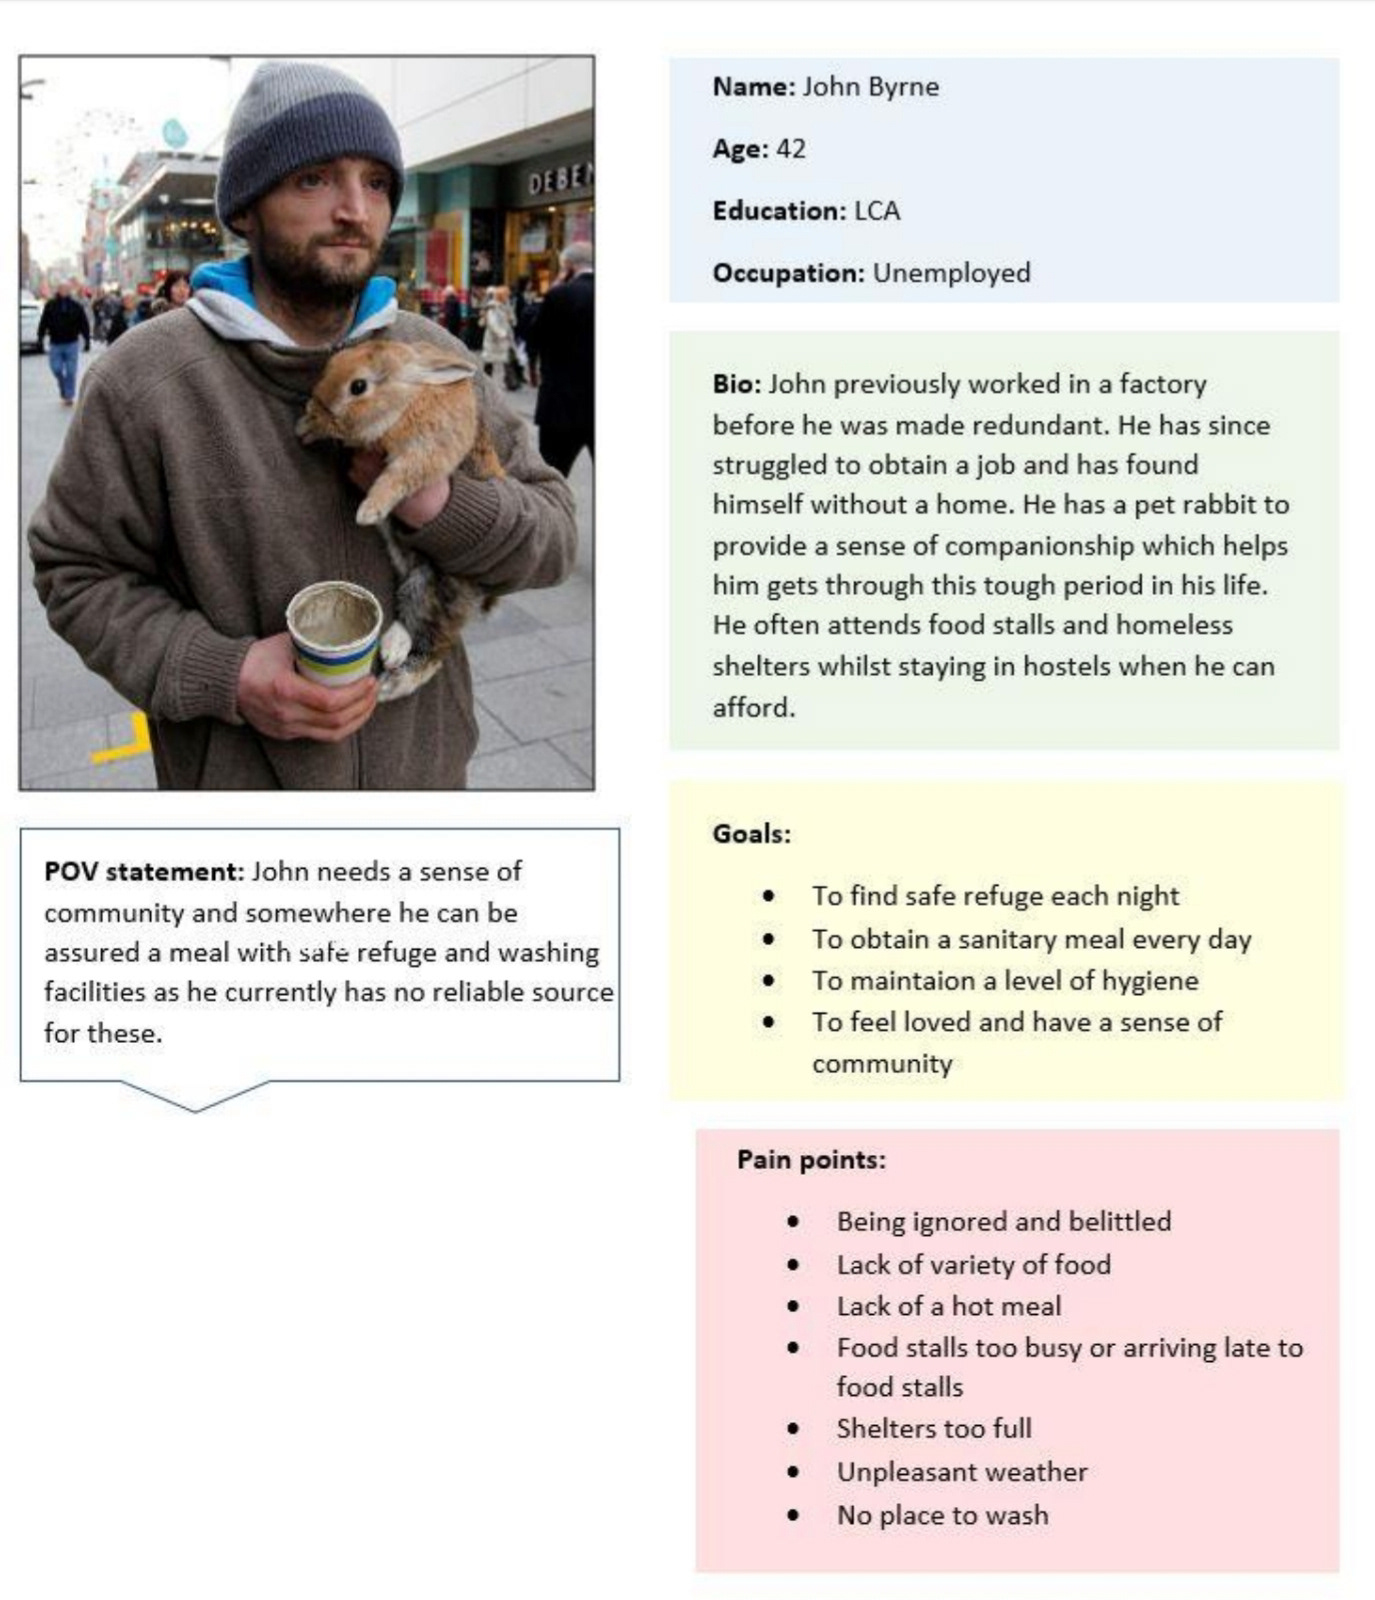
Persona for end user
- Summary of Insights -
A summary of insights from the personas for clarity purposes are as follows:
- Food safety regulations are a major obstacle in safe transport and safe storage of food
- It is vital to know exact temperatures of food at each stage of the process to class it as safe
- Small companies tend to not have a lot of waste and find simple ways to use what they have
- At the end of the food chain there is no way of heating/cooling food appropriately
- Containers both in storage and in transport are currently vulnerable to cross-contamination
- Conclusion -
In conclusion, these findings offer a different dynamic for potential product developers to understand the problem and stakeholders involved within this sector. My team and I gathered information from every section along the supply chain using our stakeholder map. This allows the development team to not only view the problem as a whole, but also dig deeper into each component, giving both breadth and depth to the problem space. The key findings from the personas compile the common pains and gains from the empathy maps into succinct points of interest for the team to focus on in the concept generation phase. These points can be analysed and developed further to assemble a final useful product that will help to effect a step-change reduction of food waste in the Hospitality and Food Service (HaFS) sector.
